Supabase Quickstart

Quary is an open-source BI/analytics platform for engineers. This guide demonstrates how to connect Quary to a Supabase database, load sample data, create and test data models, and build charts.
While this guide focuses on Supabase, the steps outlined here can be applied to other Postgres-compatible database, such as a simple Postgres instance, Redshift, or others.
Prerequisites
Before starting this guide, ensure the following prerequisites are met:
- Supabase project: Create a new project here.
- Visual Studio Code: Download it here.
- Quary Extension: Install Quary from the Visual Studio Code marketplace.
- Quary CLI: Install the Quary CLI by following the instructions here.
- PSQL (Postgres CLI): Follow these instructions to install the PSQL CLI. It is used to load the sample data into the database & set up the analytics schema for Quary.
Step 1: Supabase setup
Prepare connection details
- Create a
.envfile in an empty folder calledsupabase_guide
# create an empty folder
mkdir supabase_guide
# move into that folder
cd supabase_guide
# create an empty .env file
touch .env- Next, store the connection details for the database in the newly created
.envfile. This file is used by Quary to connect to the Postgres database. Find the details by navigating to the database settings page as shown below, or click here to be taken there directly. On the database settings page, select the desired database. The contents of the .env file should look like this:
PGHOST=aws-0-eu-west-2.pooler.supabase.com
PGUSER=<postgres_user>.<project_id>
PGPASSWORD=<password_created_on_setup>
PGDATABASE=postgres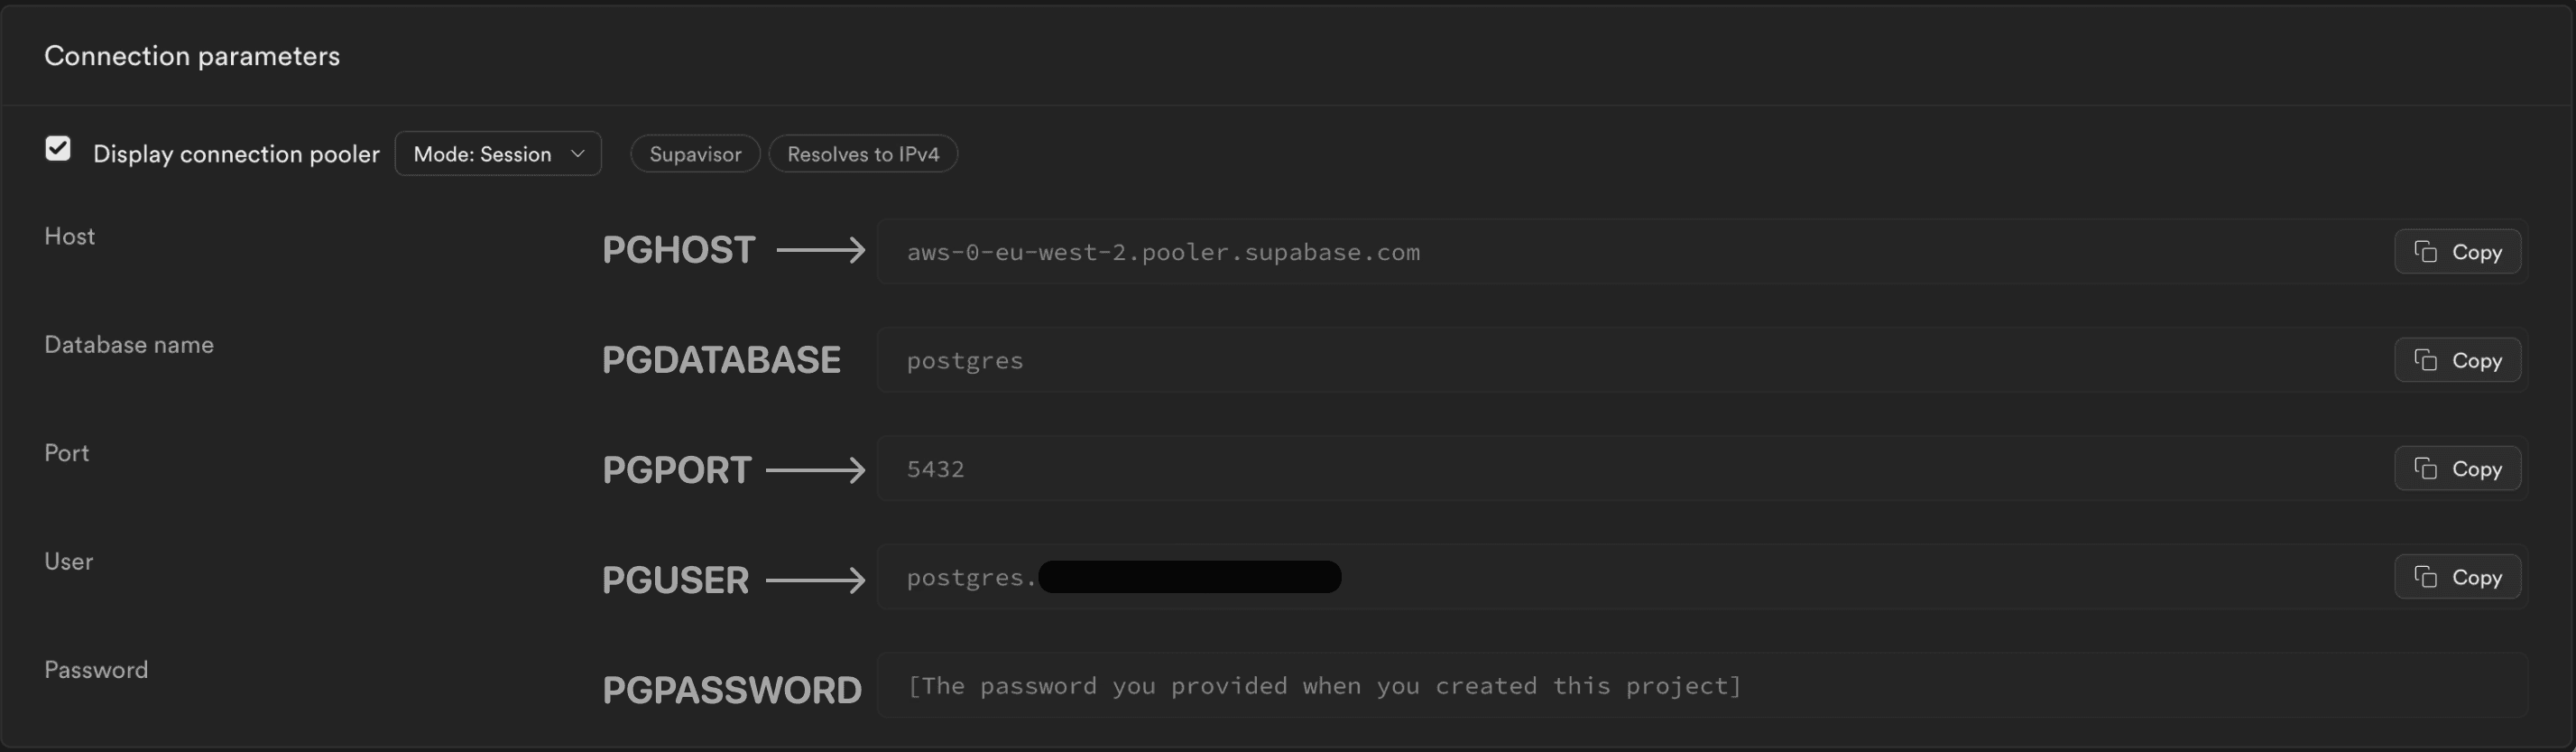
Load sample data
The following steps load some sample data. Alternatively, just use existing data from your database and follow along.
- Clone the sample data repository into the folder created in the step above:
git clone https://github.com/quarylabs/PostgresSampleData.git- Run the following commands in the terminal to create a schema called
webshopand load the sample data into it:
# Load environment variables from the .env file
export $(grep -v '^#' .env | xargs)
# Create the demo 'webshop' schema
psql -c "CREATE SCHEMA webshop;"
# Execute SQL scripts from the sample data repository to create tables and populate data
psql -f PostgresSampleData/data/create.sql
psql -f PostgresSampleData/data/products.sql
psql -f PostgresSampleData/data/articles.sql
psql -f PostgresSampleData/data/labels.sql
psql -f PostgresSampleData/data/customer.sql
psql -f PostgresSampleData/data/address.sql
psql -f PostgresSampleData/data/order.sql
psql -f PostgresSampleData/data/order_positions.sql
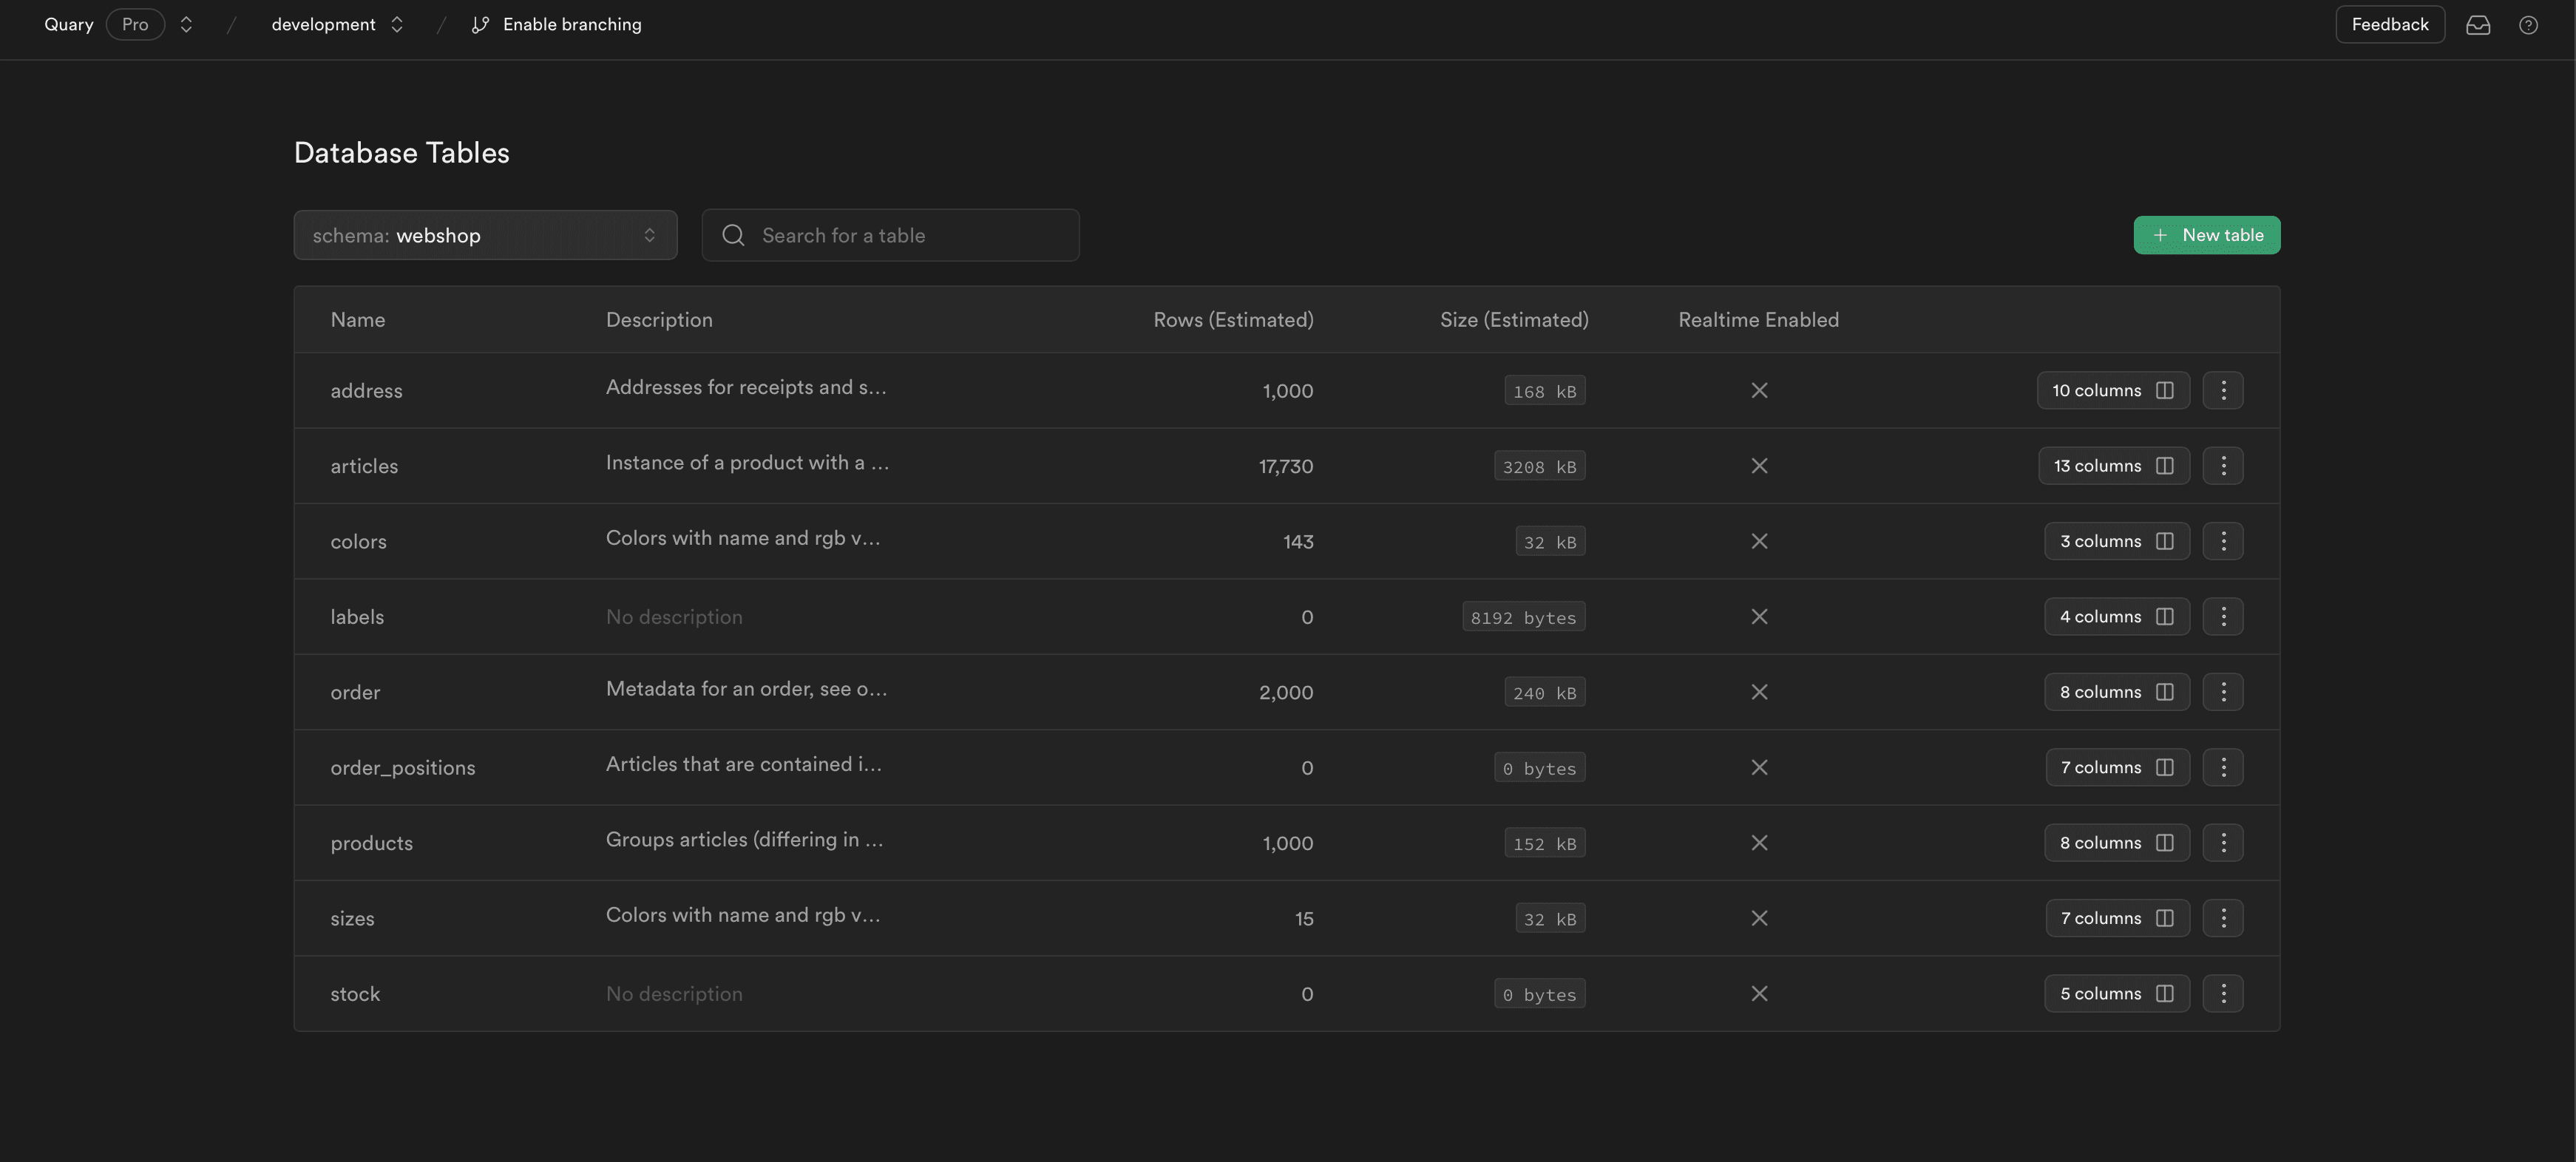
psql -f PostgresSampleData/data/stock.sqlThese tables should now be present in your the webshop schema. In Supabase, this should look like:
Step 2: Quary setup
To set up Quary for the Supabase project, create a dedicated analytics schema and configure Quary to use it. Choose a name for the target schema, the following steps use analytics, but feel free to select a name that suits.
Create the quary.yaml file
- Create the schema
analyticsfor your Quary project. :
# Load environment variables from the .env file
export $(grep -v '^#' .env | xargs)

# Create the Quary schema (replace 'analytics' with the desired schema name)
psql -c "CREATE SCHEMA analytics;"- Create a
quary.yamlfile in the root of the project folder. This file contains the project configuration. For Postgres, all that is needed is to specify the freshly prepared schema.
postgres:
  schema: analytics # Replace 'analytics' with the chosen schema name
Test the connection
- To test the connection to Postgres, run the following command in the terminal.
quary build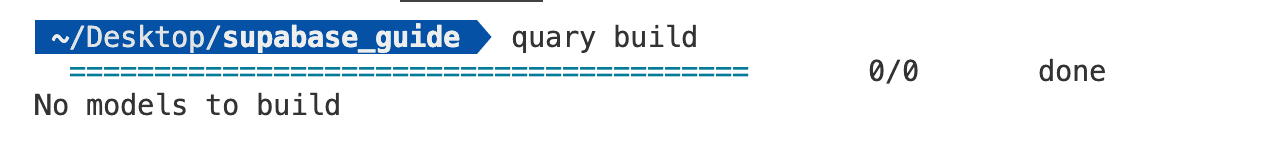
If there are any issues connecting to the database, raise an issue with Quary or refer to the Supabase documentation.
Step 3: Create the first Chart
Import Sources
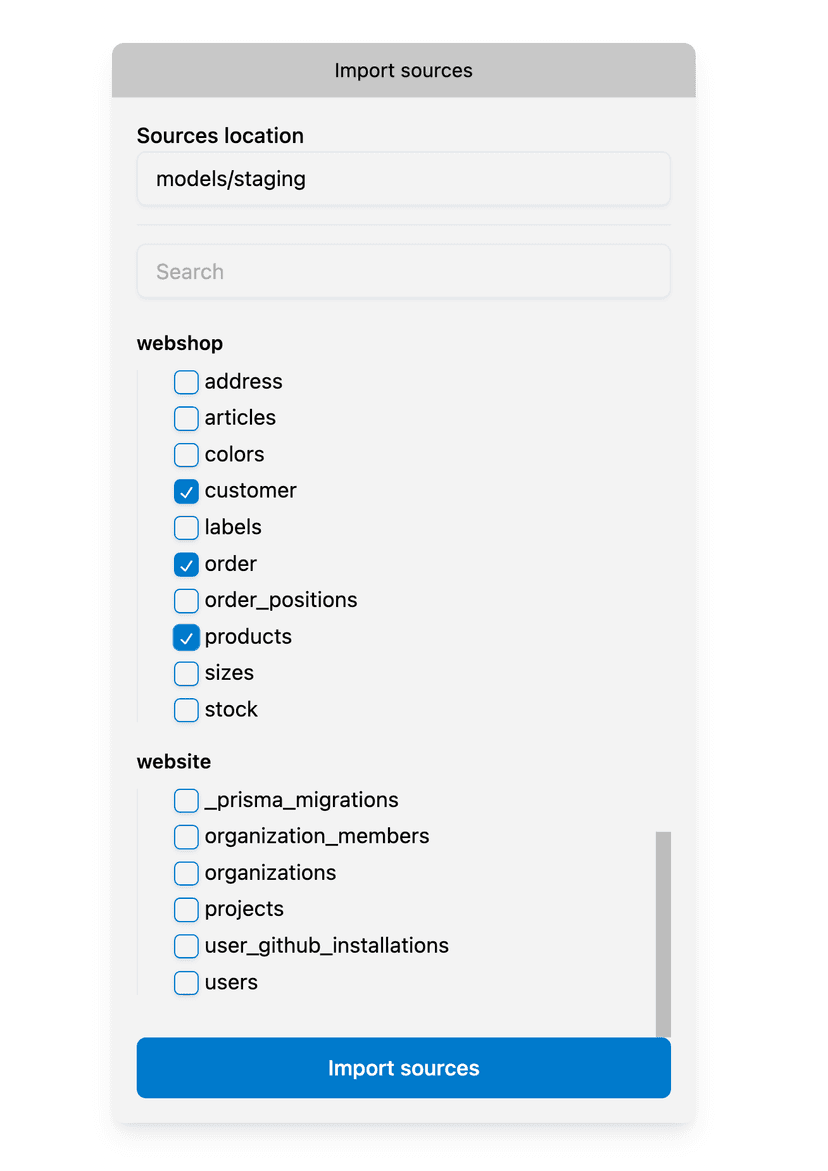
While sources can be created by hand, it's easier to use the Quary: Import Sources command.
- In Visual Studio Code, open the command palette with
CMD+SHIFT+P(orCTRL+SHIFT+Pon Windows) and execute theQuary: Import Sourcescommand. This flow will open the following dialog to add sources:
-
For this guide, select the 3 tables (
customer,order&products) in thewebshopschema. -
Click the
Import sourcesbutton. Quary will then generate the following files:- A
schema.yamlfile that holds metadata and configuration for the sources & models in the project. - Helpful model files that are useful for things like type conversions. In this case, it created
stg_customer.sql,stg_order.sql&stg_products.sql.
- A
Fetch the data
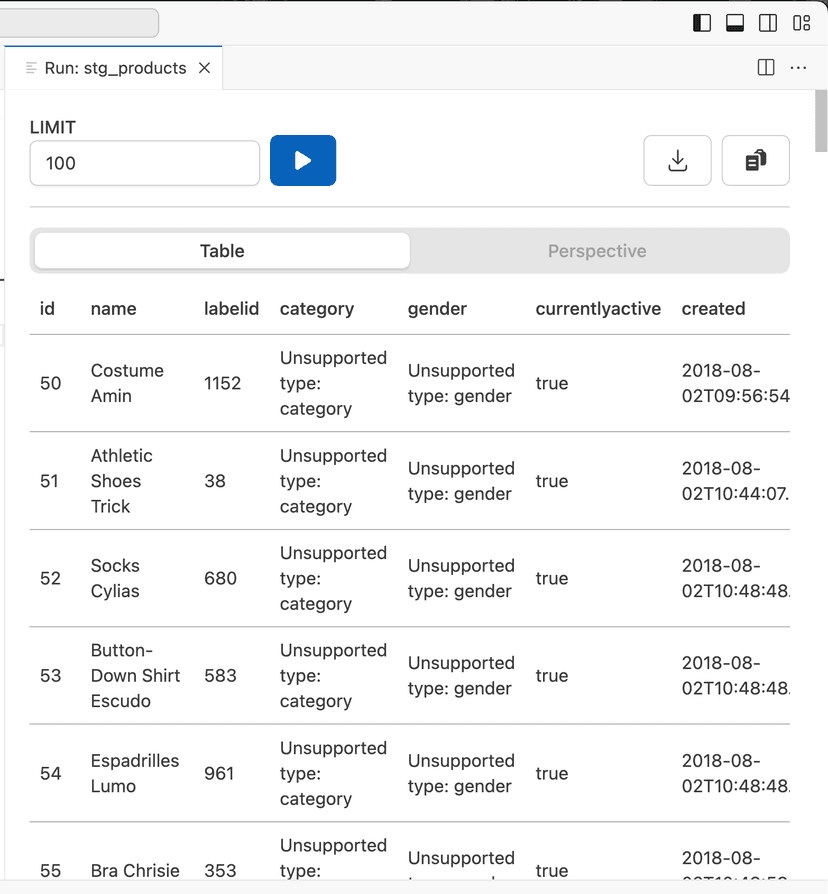
- Open the newly created
stg_products.sqlfile. - Click on the Results button (play button) or use the
CMD+ENTER(CTRL+ENTERon Windows) shortcut.

- Note those unsupported types in the table
webshop.products. We will address this in the next steps.
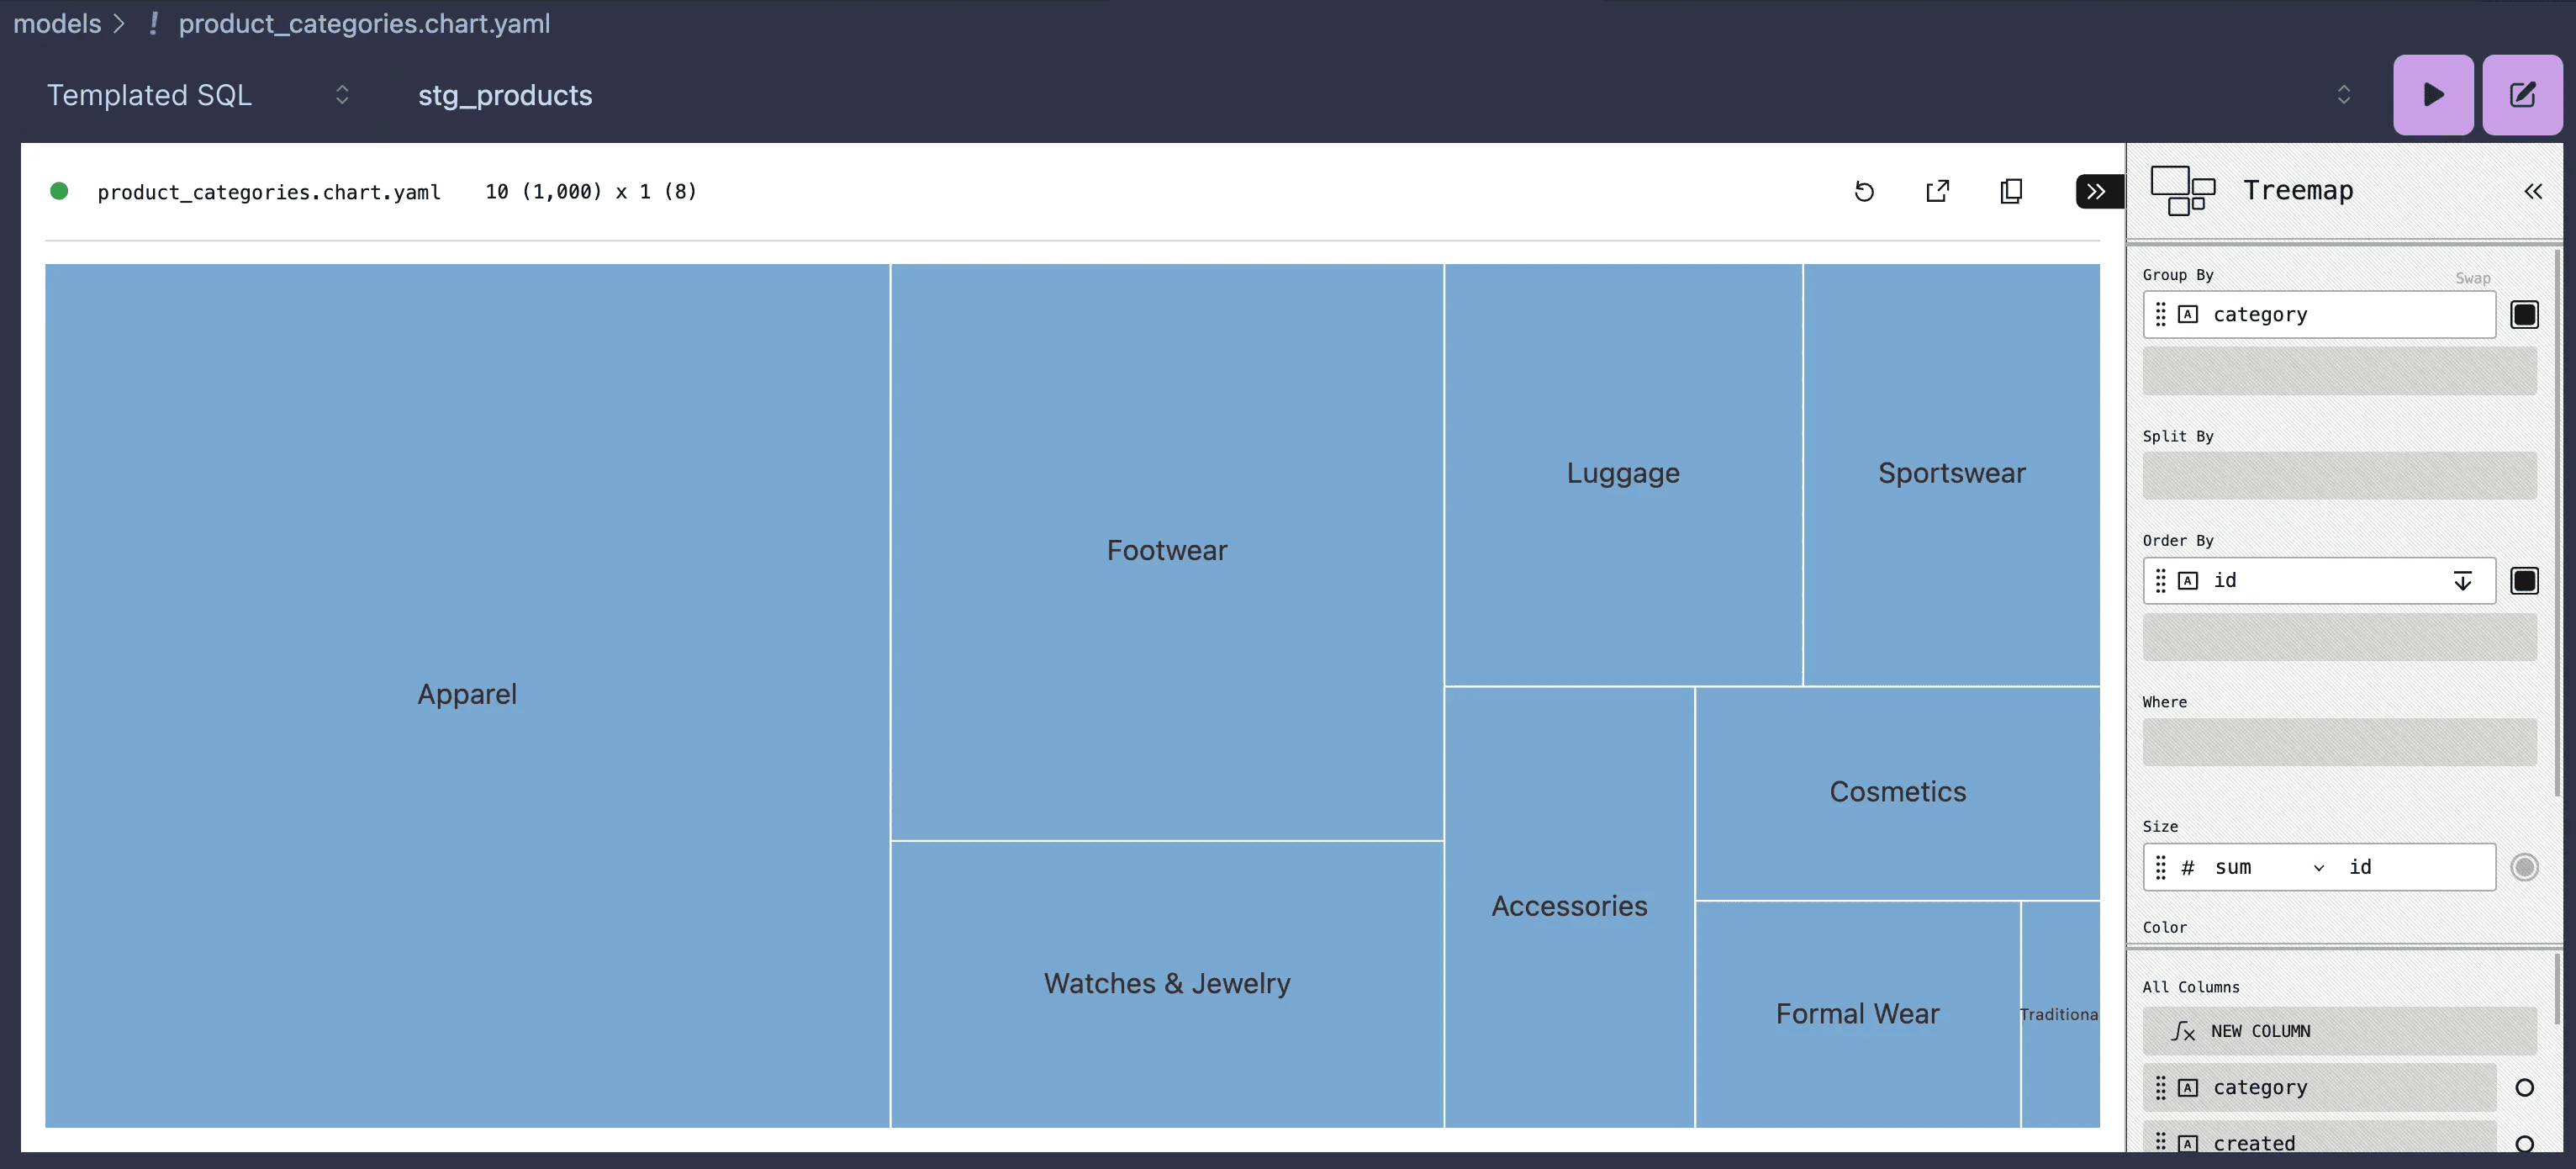
Create the Chart
In order to answer the question "What are the most common categories of products that I sell in my web-shop?", create a Chart from the
stg_productsmodel.
- Create a new file called
product_categories.chart.yamlin themodelsfolder. - Change the Asset Type dropdown to
Templated SQLand paste the following query. Note the conversion toVARCHAR:
SELECT
    id AS id,
    name AS name,
    labelid AS labelid,
    category::VARCHAR AS category,
    gender::VARCHAR AS gender,
    currentlyactive AS currentlyactive,
    created AS created,
    updated AS updated
FROM q.raw_products- Pull the data with the Play button (in the top-right corner).
- Customize the chart to display the data as a
Treemap.- Select the
TreemapChart type. - Set the
Sizeattribute tosum id. - Set the
Order Byattribute toidin descending order. - Set the
Group Byattribute tocategory.
- Select the
Step 4: Create the first Model
In order to answer the question "Who are the top customers in my web-shop by sales?", create a new model that joins the
stg_customer&stg_ordertables.
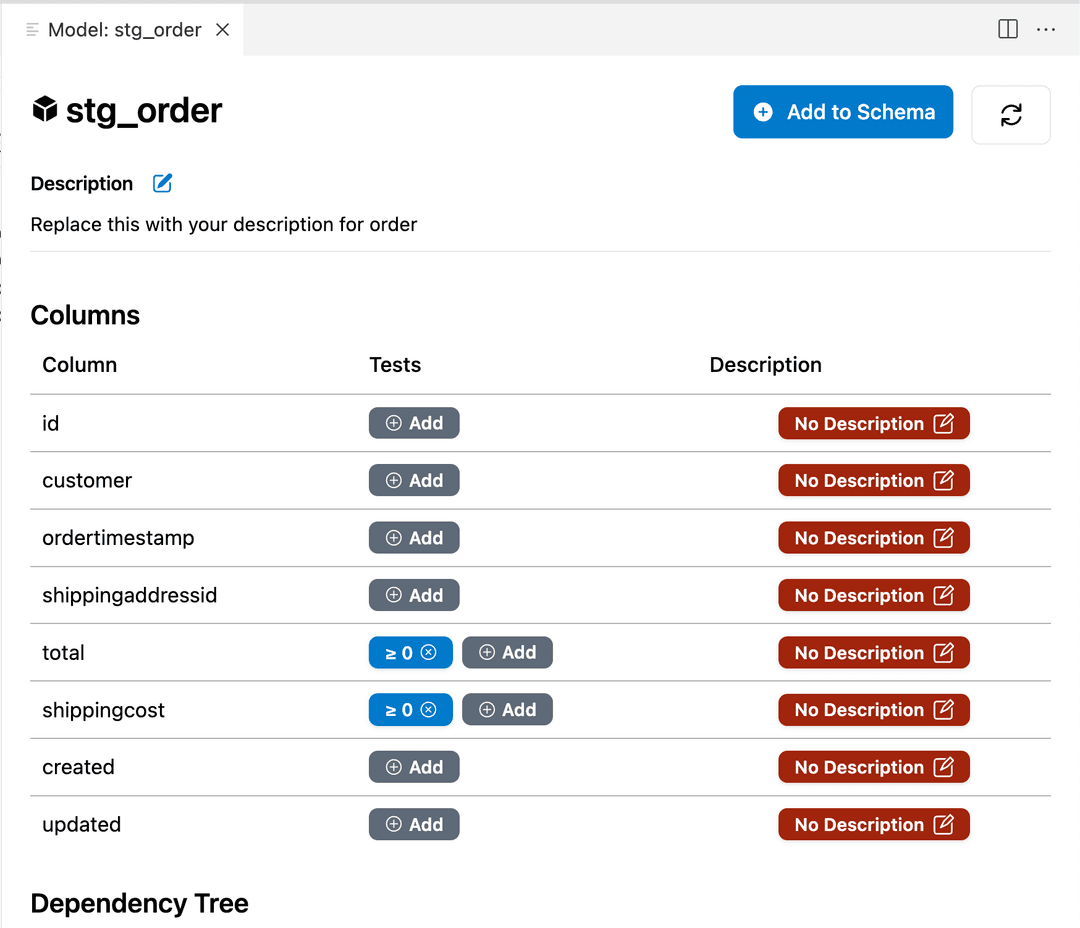
Open the documentation
- Open the
stg_order.sqlfile in Visual Studio Code. - In the top-right corner of Visual Studio, click on the Documentation button (book icon) or use the CMD+D (CTRL+D on Windows) shortcut. This will open a panel which allows for interactively updating documentation and adding tests to the model.
Add tests
To ensure the data is clean and accurate, add tests to the model. Generally one could expect that the total & shippingcost columns in the stg_order model are always greater than or equal to 0.
- Click on the
Addbutton under "Tests" next to thetotalcolumn. - Select
gtein the test type drop-down. - Enter 0 as the value.
- Repeat the steps above for the
shippingcostcolumn.
Run the following in the terminal:
quary test -sThis will run the tests against the sources (not the tables in the database as these don't exist yet!) and low and behold you will see:
An error returned from database: operator does not exist: money < integer
Transform the data
The error above is due to the total and shippingcost columns being of type money. To maek the data easier to work with, let's remove the sign from the inputs & convert the total and shippingcost columns to plain Decimal type in Postgres.
- Replace the contents of
stg_order.sqlto look like this:
SELECT
    id AS id,
    customer AS customer,
    ordertimestamp AS ordertimestamp,
    shippingaddressid AS shippingaddressid,
    CAST(REPLACE(REPLACE(total::TEXT, '$', ''), ' ', '') AS DECIMAL(10, 2)) AS total,
    CAST(REPLACE(REPLACE(shippingcost::TEXT, '$', ''), ' ', '') AS DECIMAL(10, 2)) AS shippingcost,
    created AS created,
    updated AS updated
FROM q.raw_order- Re-run the following in the terminal and low and behold you will see working tests.
quary test -sall tests (2) were run and passed.
Create the Model
Models are the fundamental building block in Quary. Models transform data from another table or tables from the same database to anticipate questions people may ask of the data. Think of them as derived tables that can be built up and reused.
- Create a new file called
customer_orders.sqlin themodelsfolder. - Paste in the following query:
SELECT
    customers.id as customer_id,
    customers.email as email,
    orders.id as order_id,
    orders.total as total,
    orders.shippingcost as shippingcost
FROM
    q.stg_customer AS customers
JOIN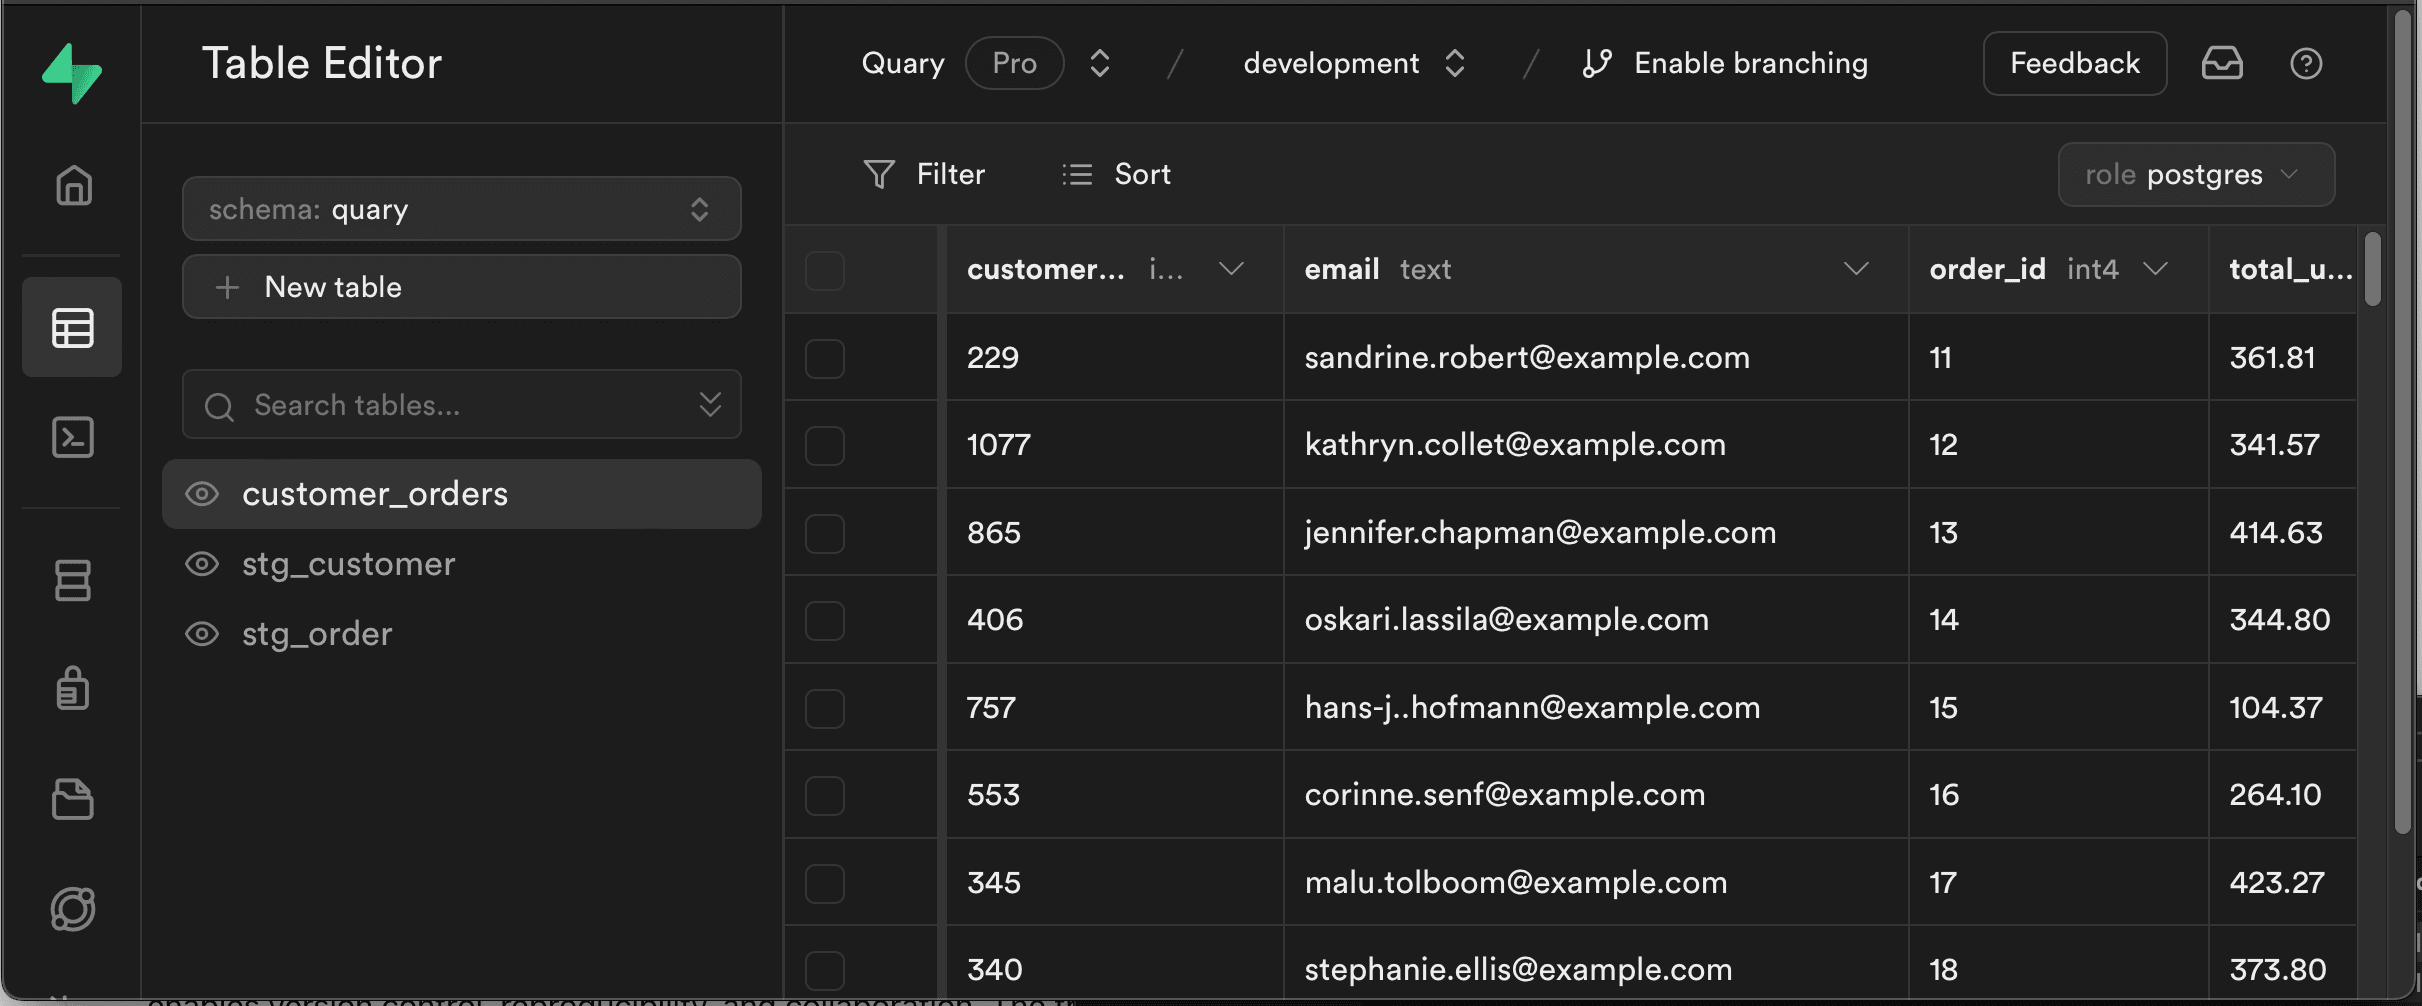
q.stg_order AS orders ON customers.id = orders.customer- Just like before you can see the results of the model by clicking the play button in the top-right corner or looking at the documentation tab.
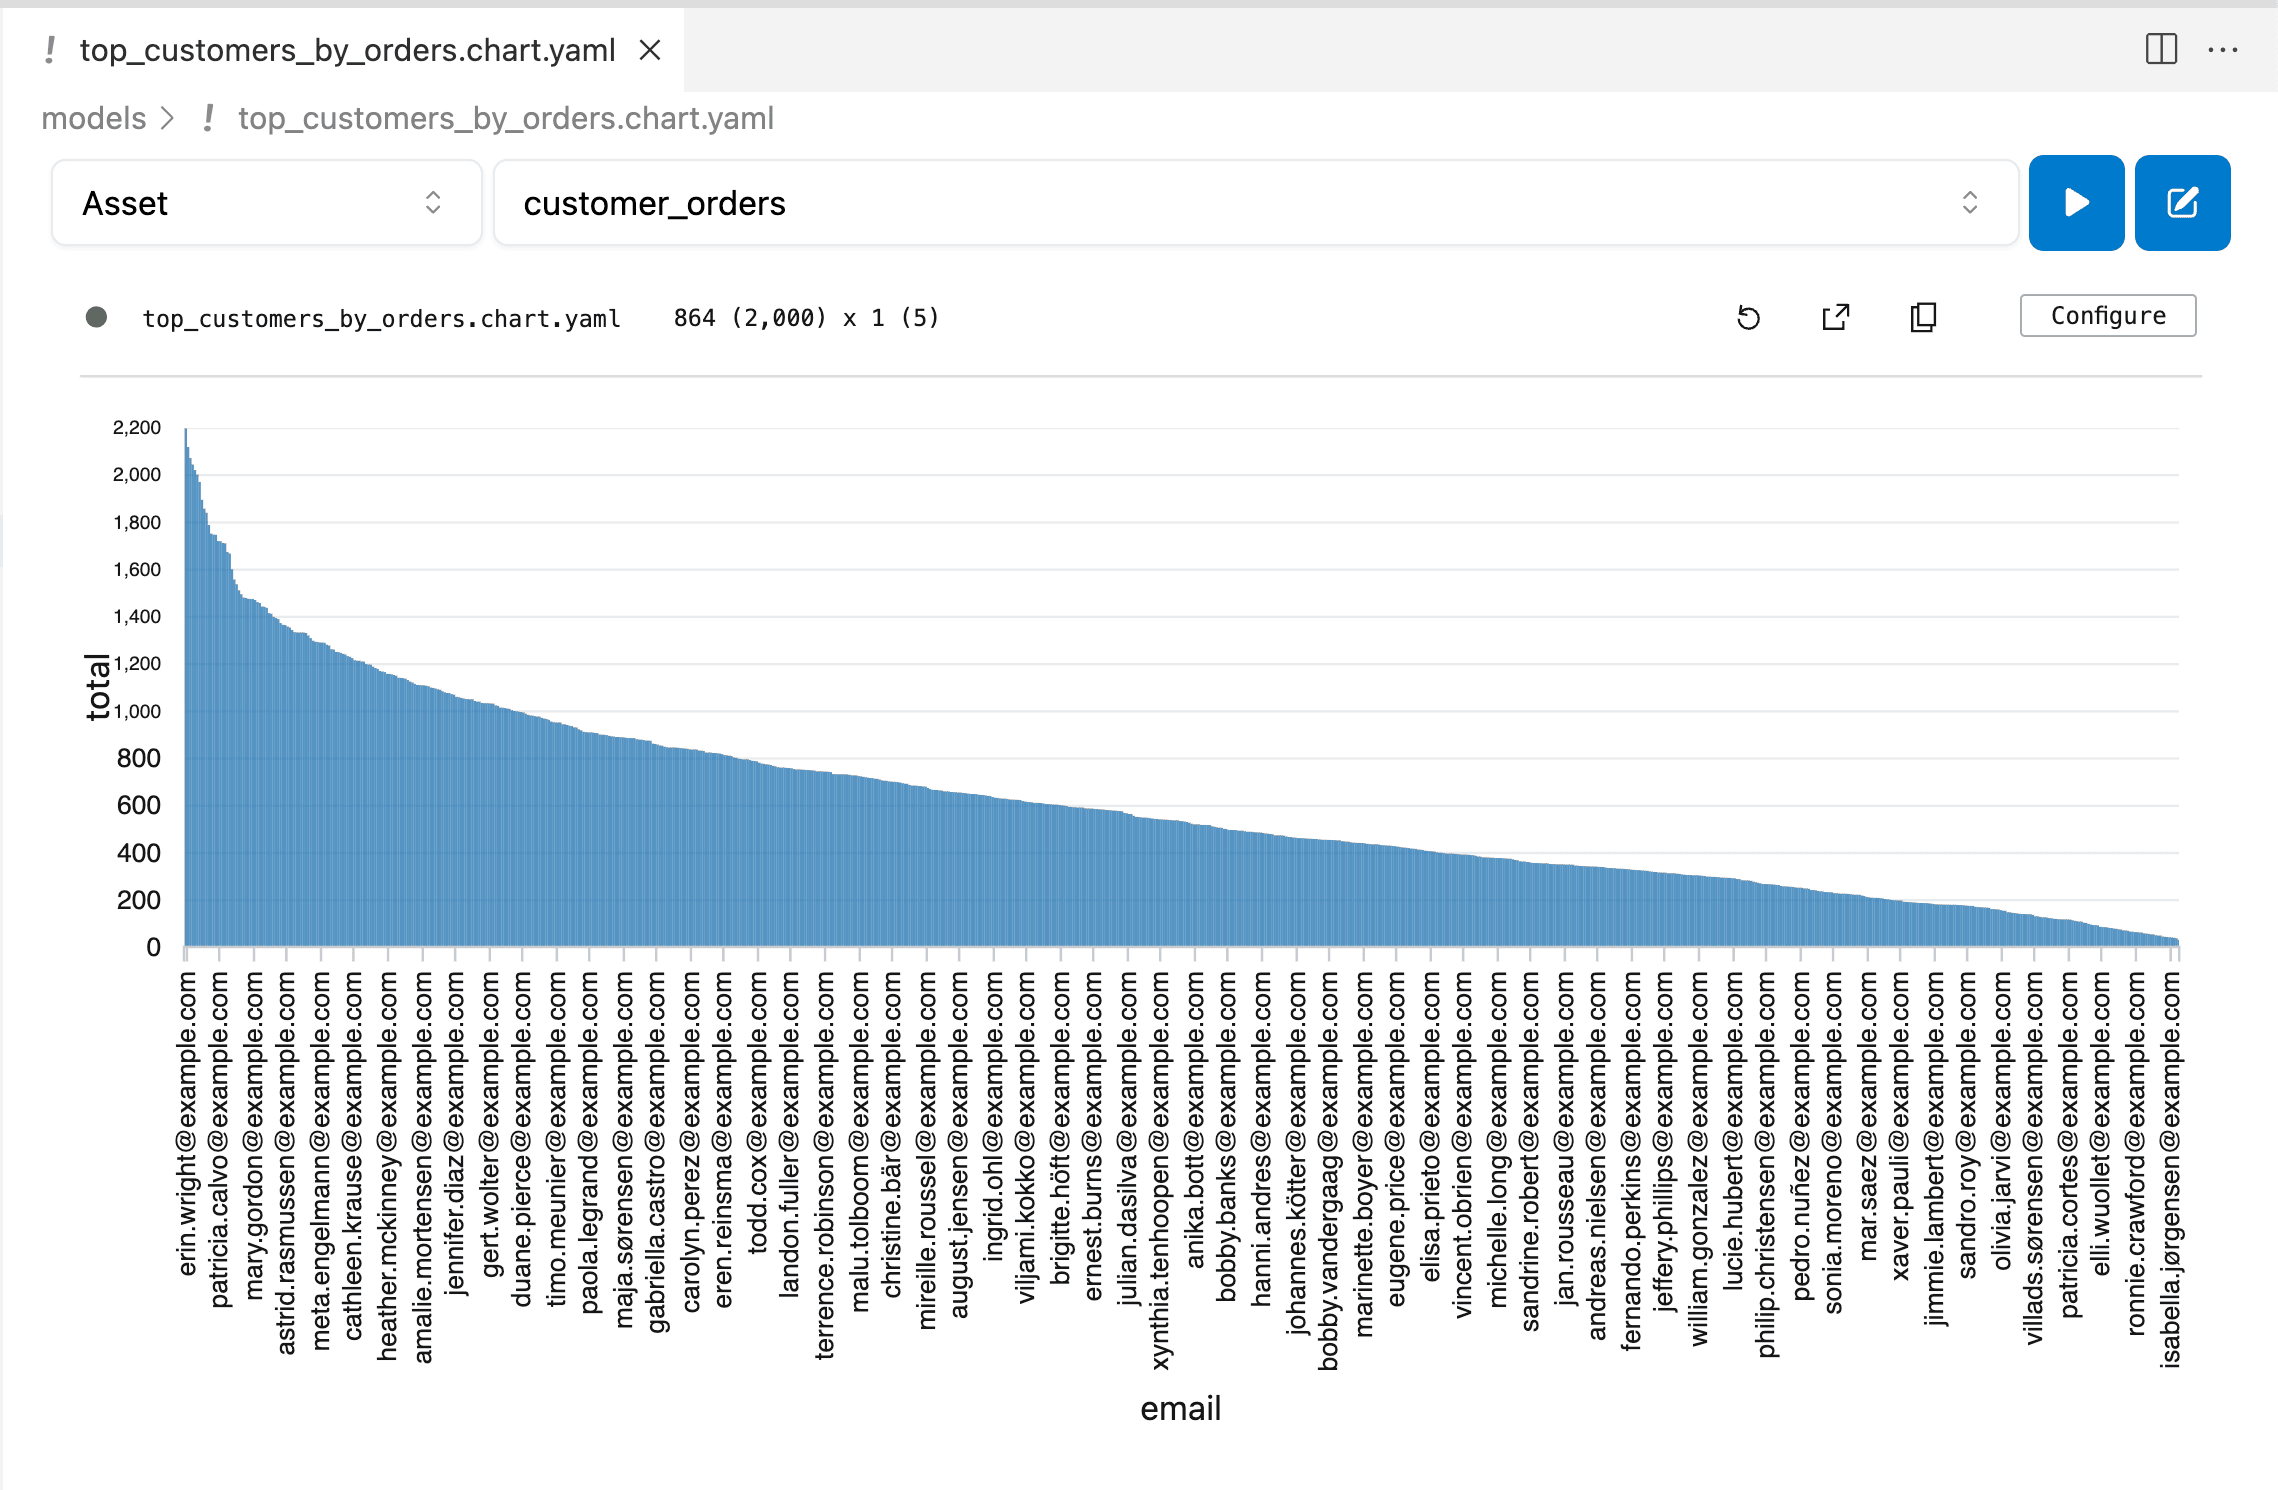
Visualize the Model
With the model created, create a chart from it.
- Create a new file called
top_customers_by_orders.chart.yamlin themodelsfolder. - Change the 'Asset Type' dropdown to
Assetand select the newly createdcustomer_ordersmodel. - Pull the data with the play button (in the top-right corner).
- Customize the chart to display the data as a
Y Bargraph:- Select the
Y Barchart type. - Set the
Group Bychart type to email. - Set the
Y Axisto besum total. - Set the
Order Byattribute tototalin ascending order.
- Select the
Step 5: Deploy Models to Supabase
Now that the analysis is done, push the transformed & tested models up to Supabase with the Quary CLI tool for reuse.
- Open a new terminal in the project and run:
quary build
quary test
This will create the models inside the target database in the specified schema, as shown in the Table Editor tab in the Supabase console below and run the tests.
That's all for now! Build amazing things with Quary and join the community here:
Step 6: (Optional) Push to git
Version control is essential for tracking changes to project files. Here's how to set up a Git repository for the Quary project:
- Initialize a Git Repository: Navigate to the root of the Quary project folder in the terminal and type:
git init- Create a
.gitignoreFile: Some files should not be checked into version control (e.g., environment variables). Create a.gitignorefile in the project root and add the necessary files/folders. For a Quary project, the.gitignoremight look something like this:
.env- Add the files and commit: Stage and commit the files with the following commands:
git add .
git commit -m "Initial commit"